
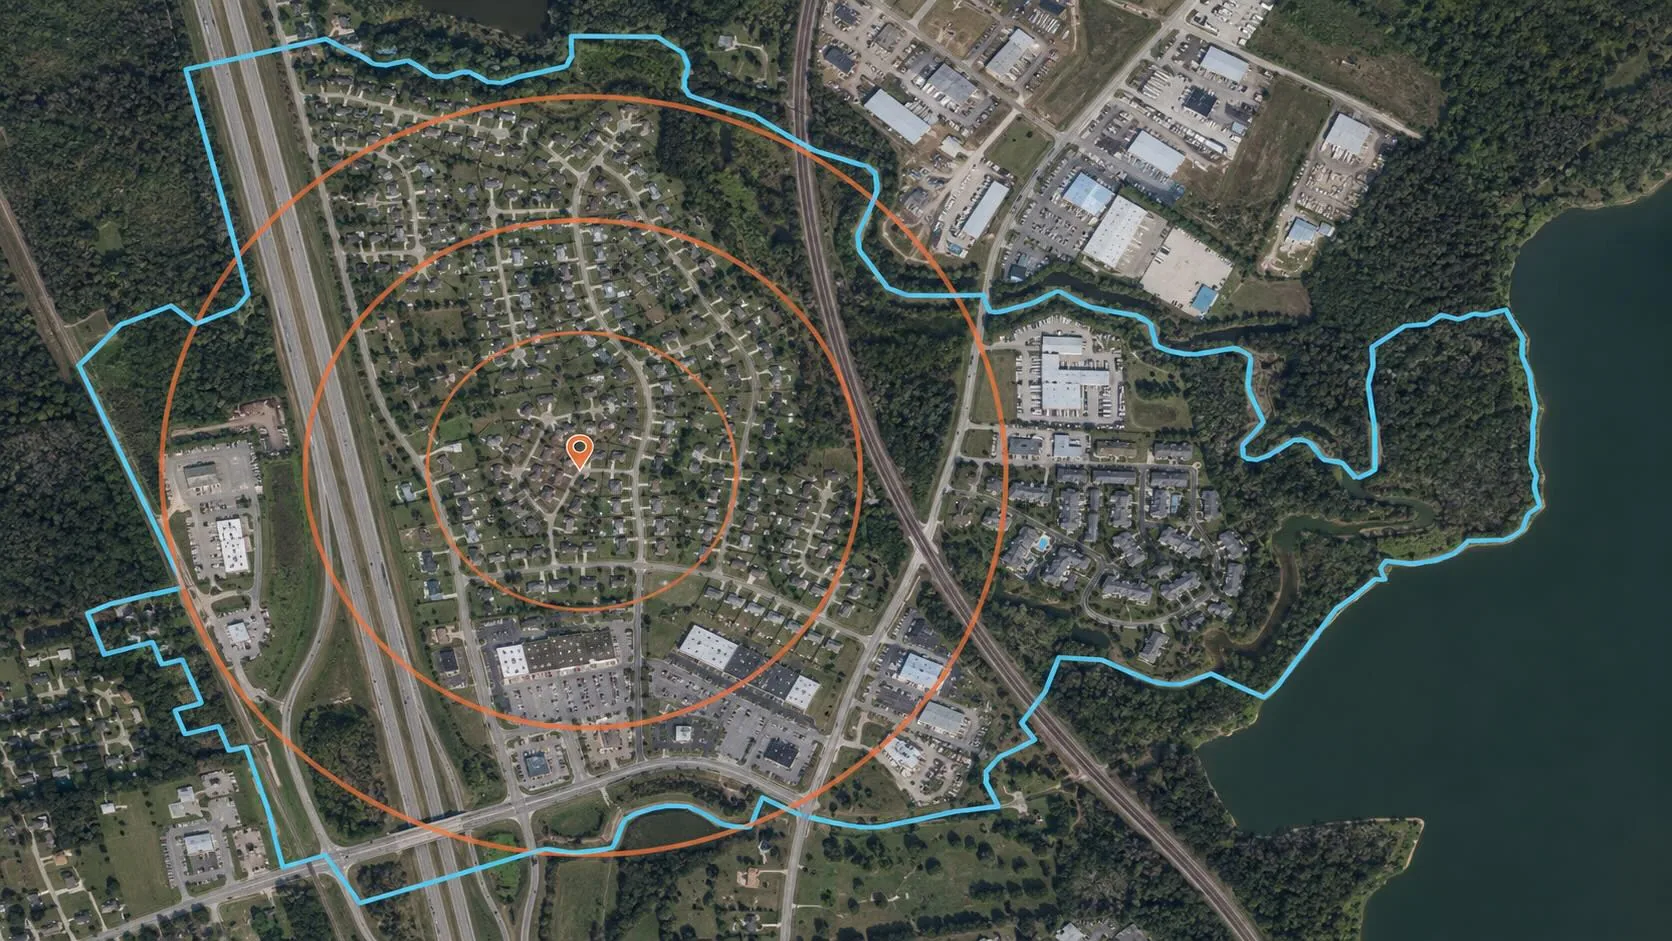
Every appraiser has done it: drop a map pin at the subject location, then draw three concentric circles around it—usually at 1-, 3-, and 5-mile radii. It’s fast. It’s easy for clients to understand. It also has almost nothing to do with how neighborhoods actually work.
The attraction is understandable. We appraisers work in a competitive environment, submitting bids with short, sometimes unreasonably short turnaround times. Everyone's looking for something that will give us an edge over the competition. Independent fee appraisers like me are competing against corporate appraisers working for multibillion-dollar real estate firms with huge IT departments that spend millions on bespoke appraisal software. So, taking the easy route—defining a neighborhood or market area with a simple set of radius rings? I get it. It’s a no-brainer that’s so easy, it usually wins by default.
The problem is that an n-mile ring centered on the subject property doesn’t know where a subdivision ends and an industrial park begins. It doesn’t differentiate between railroad tracks and four-lane highways, between the shores of a lake or reservoir and the boundaries of a county or municipality. It correlates to nothing except an infinite number of points that are precisely the same distance from the subject property.
Census block groups are different. The difference isn’t just aesthetic, either. It’s about who drew the lines and how.
The part most appraisers don’t know: local people helped draw the lines
Block-group boundaries aren’t simply drawn by Washington bureaucrats and imposed on local communities. Every decennial census cycle, the Census Bureau runs the Participant Statistical Areas Program, or PSAP. It is a voluntary partnership program through which designated participants can review and suggest changes to proposed boundaries for census tracts, block groups, census-designated places, and certain other statistical areas. Participants include local and tribal governments, regional planning organizations, and state Census Data Centers. Here’s an excerpt from the U.S. Census Bureau’s 2020 PSAP flyer:
Statistical boundaries let us give you the small-area statistics and spatial data you need. You know your local community best. By participating in PSAP, you can help us provide relevant, useful data about population, income, and housing for small-area geographic analyses. The Census Bureau uses these boundaries to tabulate data for the 2020 Census, the American Community Survey, and the economic census. Data tabulated to PSAP geographies are used by tribal, federal, state, and local agencies for planning and funding purposes, as well as by the private sector, academia, and the public.
That’s the important piece: there is an actual mechanism through which someone familiar with the area can look at a proposed boundary and say, “No, that line should follow the creek, not cut through the middle of this subdivision.” It does not mean every block-group boundary received that kind of local attention. But in participating areas, PSAP gives local knowledge a formal place in the process. That is a much better provenance than an arbitrary circle centered on whatever parcel happens to be the subject.
It’s not just an appraiser’s workaround—researchers use them the same way
I’m not the only one making this substitution. Urban researchers studying neighborhood-level income and social patterns routinely use block groups as a working definition of “neighborhood.” They are consistently defined nationwide, cover the entire country, and provide data at a much smaller scale than census tracts, counties, or municipalities. For appraisal purposes, that makes a block group a reasonable starting point for identifying the kind of area within which comparable properties may compete.
There is empirical support for that choice. In a 2013 U.S. Census Bureau working paper, How Big Is Your Neighborhood? Using the AHS and GIS to Determine the Extent of Your Community, Kwame Donaldson used responses from the American Housing Survey together with GIS data to estimate how far the area people think of as their community extends from their homes. He estimated the typical distance at approximately 520 to 1,060 meters—roughly the extent of one or two median-sized census block groups.
Donaldson also noted that actual neighborhoods are often bounded by highways, rivers, streams, political jurisdictions, and other established landmarks, and that the Census Bureau uses many of those same features when delineating its statistical geography. As he put it:
This makes these tabulation areas ideal proxies for actual neighborhoods.
Among the Census Bureau’s standard tabulation areas, Donaldson found that one or two median-sized block groups came closest to the neighborhood scale derived from residents’ responses. That accords with my own experience. Of the standard geographies readily available to an appraiser, a block group is the one that most closely resembles what most people mean when they think of a neighborhood. That does not establish that the subject property’s block group is necessarily the correct neighborhood boundary. It does, however, make the block group a sound starting point—one the appraiser can test against land uses, access, physical barriers, development patterns, and observed market behavior.
The honest caveat researchers raise, and one worth carrying into appraisal practice, is that block groups are still administrative boundaries. They can occasionally bisect a community that residents would consider one place, or combine areas whose residents would not consider themselves part of the same neighborhood. Block groups are a proxy for neighborhood, not a perfect map of it. But that’s a difference of degree from a radius ring, not of kind—every delineation method is a proxy. The question is which proxy has the better provenance.
Why this beats the radius ring for commercial market-area work
Set the locally reviewed boundary argument aside for a second, and the practical case still holds up—especially on commercial assignments, where the mix of uses inside a radius ring can be all over the map:
- A radius ring is indifferent to what’s actually inside it. It will happily average a stable single-family subdivision with an apartment complex, a strip of commercial parcels, and whatever else falls inside the circle, simply because they are all within a given distance as the crow flies.
- A block group nests cleanly into tract, county, and state geography. When I need to show a market-area statistic in context—median household income at the block-group level next to tract, county, and state figures—I’m comparing data across a consistent geographic hierarchy, not stitching together a custom polygon that has no equivalent at another scale.
- Radius rings are only one common way to delineate a trade area. Other methods include drive-time isochrones, gravity or Huff models, competitor-equidistant or Voronoi boundaries, and aggregations of census geography. Rings are the crudest of these methods. They are deterministic and geometric, with no behavioral or locally grounded logic behind where the boundary falls. Census aggregation is the method that inherits an actual review process behind its component boundaries.
None of this means radius rings are useless. I still include them in my reports, and for certain assignments—a straightforward suburban tract with no obvious dividing features, for example—a 1-mile ring and a block group might cover nearly the same area. But when there’s a real boundary nearby—a highway, a floodplain, a school-district line, or an obvious change in housing stock—the block group is more likely to reflect it. That isn’t guaranteed, but it gives the appraiser something more geographically meaningful to evaluate than distance alone.
The bottom line
I still prepare 1-, 3-, and 5-mile radius demographics. I think many clients expect them, and they do have their place. But when I’m making the case for what the neighborhood or market area is, rather than simply running a canned demographic report, I lean on the block group. It’s the one geography in my usual toolkit for which the boundary itself may carry a paper trail of local review, rather than being an accident of where I put the pin.
That’s the kind of distinction that separates a defensible commercial appraisal from a boilerplate one—and it’s the standard I hold my own commercial real estate appraisal work in Mississippi to, on churches, retail and industrial properties, apartment complexes, vacant land, and everything else that crosses my desk.